
Every four years, somethinIf something unusual happens inside the Bitcoin network, the reward miners earn for adding new blocks to the blockchain gets cut in half. This event, called the halving, has happened four times so far, and each cycle has left a visible footprint on Bitcoin’s price history. A bitcoin halving chart is the tool most investors and researchers use to study those footprints and decide what they might mean for the future.
But halving charts can look intimidating at first glance. The Bitcoin Halving Chart: The Ultimate 2026 Guide every investor needs to understand BTC price cycles, historical data, and what comes next.
They combine price lines, vertical markers, percentage changes, and sometimes logarithmic scales all in one image. If you have ever stared at one and felt confused, this guide is written for you.
Over the following sections, you will learn what Bitcoin halving is, how to read the key elements of a halving chart, what the data from all four halvings tells us, and what limitations to keep in mind. Everything here is updated through 2026, written in plain language, and built around verified data rather than speculation.
What Is Bitcoin Halving and Why Does It Happen?
Bitcoin was designed with a fixed supply. No more than 21 million bitcoins will ever exist. To control how quickly those coins enter circulation, the system automatically cuts the mining reward in half roughly every 210,000 blocks, approximately every four years.
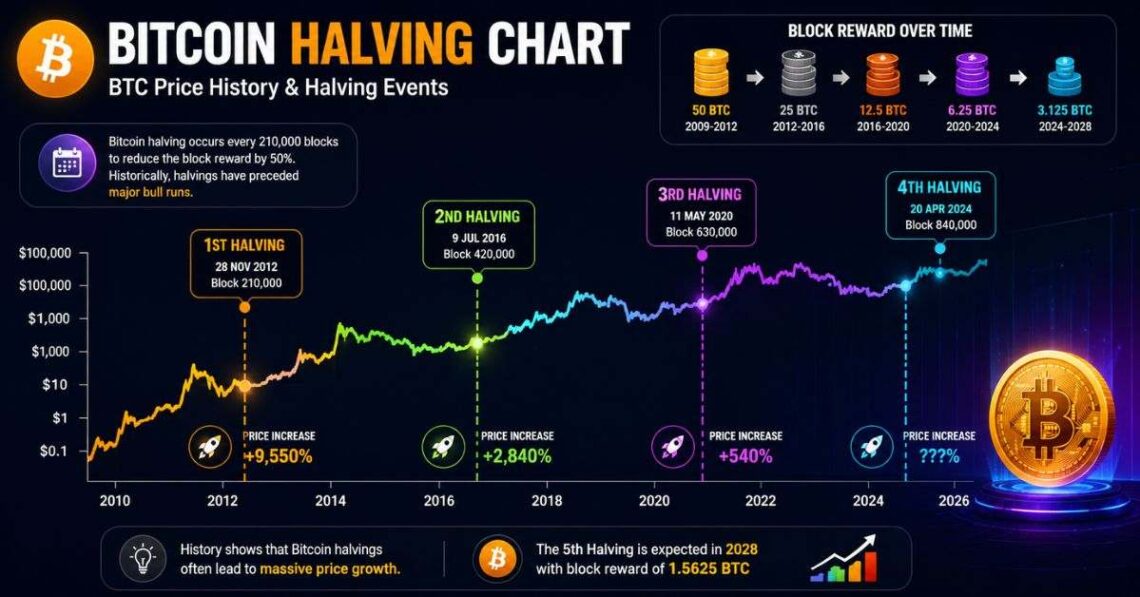
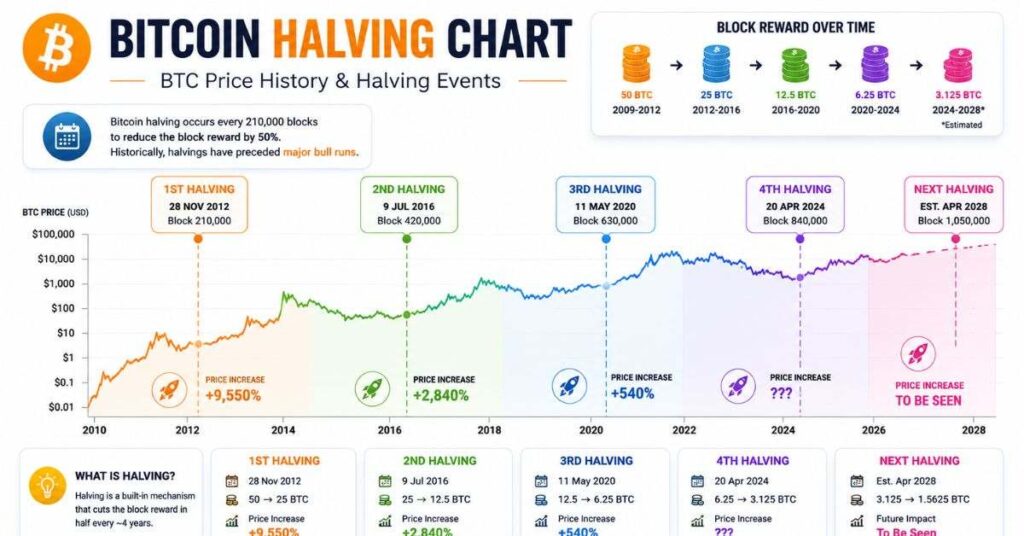
When Bitcoin launched in 2009, miners received 50 BTC for each block they added. The first halving, which occurred in November 2012, reduced the reward to 25 BTC. The second, in July 2016, cut it to 12.5 BTC. The third, in May 2020, brought it to 6.25 BTC. The fourth halving in April 2024 reduced it to 3.125 BTC.
This gradual reduction mimics the way precious metals become harder to mine over time. As the supply of new coins slows, basic economics suggests that if demand stays the same or grows, prices may rise. That relationship between supply and demand is the core reason halvings attract so much attention from investors and researchers.
The halving is not a corporate decision or policy change; it is automatic, written directly into Bitcoin’s code, and will continue until approximately the year 2140, when the last Bitcoin is estimated to be mined.
What These Price-Cycle Charts Actually Show
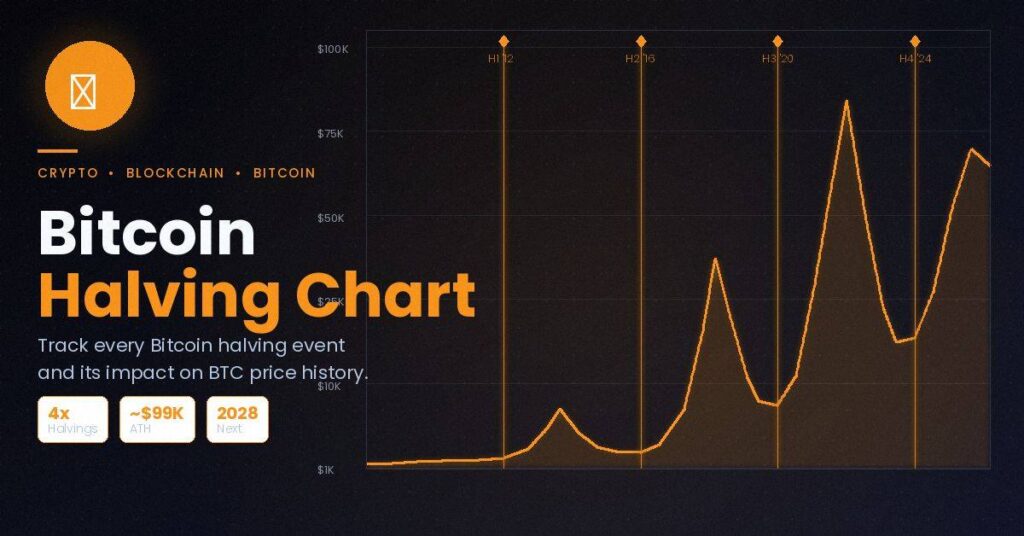
A bitcoin halving chart overlays Bitcoin’s historical price with vertical lines marking the exact dates when each halving occurred. The chart gives investors a visual way to study what happened to the price before, during, and after each halving event.
Most halving charts use a logarithmic scale on the price axis rather than a standard scale. This is because Bitcoin’s price has grown by thousands of percent over its lifetime. On a standard scale, early price movements look completely flat compared to recent years, making them useless for comparison. A logarithmic scale compresses large numbers so that percentage gains look proportionally similar across different times.
When you look at a well-constructed halving chart, you will typically see four distinct cycles. Each cycle begins around the halving date and peaks somewhere between twelve and eighteen months later, followed by a significant correction. The size of each peak has grown smaller in percentage terms with each cycle, an important pattern to understand.
Beyond the price line and halving markers, some charts add additional layers like the 200-week moving average or on-chain metrics. These can add context but make the chart harder to read for a beginner. Starting with the basic price-plus-halvings view is always the better approach.
The Four Halving Events: What the Data Shows
Looking at Bitcoin’s actual historical data is more useful than reading general descriptions. The table below summarizes the key figures from all four halvings.
| Halving | Date | Block Reward Before | Block Reward After | Price at Halving | Cycle Peak Price | % Gain to Peak |
|---|---|---|---|---|---|---|
| 1st | Nov 28, 2012 | 50 BTC | 25 BTC | ~$12 | ~$1,150 | ~9,479% |
| 2nd | Jul 9, 2016 | 25 BTC | 12.5 BTC | ~$650 | ~$19,800 | ~2,946% |
| 3rd | May 11, 2020 | 12.5 BTC | 6.25 BTC | ~$8,700 | ~$69,000 | ~693% |
| 4th | Apr 19, 2024 | 6.25 BTC | 3.125 BTC | ~$63,800 | TBD (cycle ongoing as of 2026) | TBD |
Two clear patterns emerge. First, each cycle has produced a smaller percentage gain than the one before. Second, the time from halving to peak has stayed roughly consistent at twelve to eighteen months across the first three cycles. Neither pattern guarantees future results, but both are observations analysts cite most frequently when studying Bitcoin’s price behaviour.
Reading the Cycle Peaks and Troughs
One of the most valuable things a price halving chart reveals is the rhythm of Bitcoin’s market cycles. Each cycle follows a broadly similar pattern even if timing and scale differ.
In the months before a halving, price tends to rise as anticipation builds. After the halving, as the supply of new coins slows and demand continues, prices tend to climb toward a new all-time high.
After the peak, corrections have been severe. Bitcoin dropped roughly 84 per cent from its 2013 peak, 83 per cent from its 2017 peak, and 77 per cent from its 2021 peak. Understanding the full cycle, not just the rally, is essential for anyone using historical data to inform decisions.
The trough after each peak has also followed a pattern: the post-peak low in the first three cycles remained above the previous cycle’s all-time high. Analysts call this “higher lows”, and it is frequently cited in discussions of Bitcoin’s long-term trajectory.
How the Fourth Halving Compares to Previous Cycles
The fourth halving took place in April 2024 at block height 840,000. What made it unusual was that Bitcoin reached a new all-time high of approximately $73,000 before the halving, something that had not happened in earlier cycles, where new highs came after the supply event.
The approval of spot Bitcoin ETFs in the United States in January 2024 brought significant institutional demand, channelling fresh capital into the market ahead of the supply reduction. As of mid-2026, Bitcoin has traded in the $80,000 to $100,000 range. Whether this fourth cycle follows the diminishing-returns pattern or charts a new path due to institutional participation remains actively debated.
Understanding Logarithmic vs. Linear Price Charts
One of the most common points of confusion when looking at a bitcoin halving chart for the first time is the scale of the price axis. Most professional-grade halving charts use a logarithmic (log) scale. Understanding why this matters changes how you interpret the data.
On a linear scale, each unit on the price axis represents the same dollar amount. Moving from $1,000 to $2,000 looks the same size as moving from $60,000 to $61,000, even though the first is a 100 per cent gain and the second is less than 2 per cent.
On a logarithmic scale, each unit represents the same percentage change. A 100 per cent gain looks the same visual size regardless of the starting price. This makes it far easier to compare price moves across different time periods.
For a long-lived asset like Bitcoin, which grew from under $1 to over $70,000 in fifteen years, the log scale is simply the more honest display method. A halving chart that shows an almost straight diagonal line on the log scale is showing consistent percentage growth over time, which is a meaningful signal depending on your interpretation.
Always check which scale a chart is using before drawing conclusions. A linear chart of Bitcoin’s full history makes early cycles look meaningless, while a log chart reveals the consistent compounding structure across all four halvings.
What Miners Experience During a Halving
The halving does not just affect investors; it directly changes the economics for miners who secure the Bitcoin network.
When the block reward is cut in half, every miner’s revenue drops 50 per cent overnight if the price stays flat. This creates immediate financial pressure, especially for miners running older, less efficient hardware. Some are forced to shut down, which reduces total computing power, called ‘hash rate’, on the network.
Bitcoin’s difficulty adjustment mechanism compensates automatically. Every 2,016 blocks (roughly two weeks), the network adjusts how hard it is to mine a block. If hash rate falls, difficulty decreases, making it easier for remaining miners to earn rewards and keeping blocks arriving at a steady pace.
The hash rate has historically dipped briefly after each halving, then recovered to new all-time highs within months, driven by higher Bitcoin prices restoring profitability and hardware improvements offsetting the reduced reward.
The Stock-to-Flow Model and Halving Analysis
One of the most widely discussed frameworks for analysing Bitcoin halving cycles is the stock-to-flow (S2F) model. It measures how much of an asset currently exists (stock) relative to how much new supply enters the market each year (flow). Gold has a very high stock-to-flow ratio because only a small amount is mined annually. Bitcoin’s ratio doubles with each halving, since the annual flow of new coins is cut in half.
The S2F model predicts that as Bitcoin’s stock-to-flow ratio increases, its price should follow a corresponding upward path. In the first three cycles, the model broadly matched actual price behaviour and earned significant attention in the investment community.
However, the model has faced legitimate criticism. Price has deviated from S2F predictions in both the third and fourth cycles, and many economists argue that supply alone cannot explain price. Demand, regulation, macro conditions, and market sentiment all play important roles. Research from the MIT Digital Currency Initiative offers a useful academic perspective on these multi-factor interactions.
Comparing Bitcoin Halvings to Other Asset Cycles
Bitcoin’s four-year halving cycle is unusual in global financial markets. Most traditional assets do not have a programmatic supply reduction built into their structure. Comparing Bitcoin’s cycle to other markets helps put the pattern in context.
The table below shows how Bitcoin’s halving cycles compare to the typical behaviour of other major asset classes during periods of supply constraint.
| Factor | Bitcoin Halving Cycle | Gold Supply Cycle | Stock Market Bull Run |
|---|---|---|---|
| Supply change trigger | Automatic (every ~4 years) | Gradual (mining depletion) | No fixed trigger |
| Duration to peak | 12–18 months historically | Multi-year | 2–5 years typically |
| Average peak gain | Declining each cycle | Modest, 20–50% | 100–200% in strong runs |
| Post-peak correction depth | 77–84% historically | 30–45% | 20–50% in bear markets |
| Predictability | Moderate (pattern-based) | Low | Low |
Bitcoin’s cycles show much larger swings in both directions than traditional assets, reflecting both its early-stage market status and the outsized effect a programmatic supply cut can have on a relatively small and volatile market.
Limits of Using Halving Charts for Investment Decisions
Halving charts are useful analytical tools, but they have real limitations every reader should understand before drawing financial conclusions.
The most important limitation is sample size. Only four halvings have occurred. Four data points is an extremely small sample from which to draw reliable statistical conclusions. A pattern that appears in four events may not repeat in the fifth. Professional analysts apply this caveat seriously, even when the pattern looks compelling.
The second limitation is the changing market environment. Bitcoin in 2012 was a niche asset known mainly to cryptography enthusiasts. By 2024, it was held by major institutions and traded in regulated ETFs. The dynamics driving price in early cycles are fundamentally different from those today.
Third, correlation is not causation. Prices rising after a halving does not automatically mean the halving caused the rise. Macroeconomic conditions, global liquidity, and investor sentiment all play important roles. A Forbes analysis of digital asset investment frameworks suggests that multi-factor models outperform single-variable approaches like pure S2F analysis.
Frequently Asked Questions
What is a bitcoin halving chart?
It is a price chart that overlays Bitcoin’s full price history with vertical lines marking the exact dates of each halving event, making it easy to compare price behavior across different supply cycles.
How often does Bitcoin halving happen?
Approximately every four years, or precisely every 210,000 blocks added to the Bitcoin blockchain, whichever comes first based on actual mining speed.
Does Bitcoin always go up after a halving?
In the first three cycles it did eventually reach new highs, but the timing varied, and significant corrections occurred along the way. Past performance does not guarantee future results.
What scale should I use when reading a halving chart?
A logarithmic scale is strongly preferred for long-term Bitcoin charts because it shows percentage changes proportionally, making early and recent cycles comparable at a glance.
Where can I find a reliable bitcoin halving chart for free?
Reputable sources include CoinGlass, Glassnode (free tier), and TradingView. Always check that the chart uses verified on-chain data and clearly labels its halving dates and price sources.
Conclusion
Bitcoin’s halving mechanism is one of the most carefully studied supply events in modern financial markets, and the four cycles it has produced reveal genuinely interesting patterns worth understanding. Whether you are a curious newcomer, a long-term holder, or a researcher trying to make sense of price cycles, learning to read a bitcoin halving chart gives you a clearer window into how Bitcoin’s supply structure connects to its price history.
The key takeaways are straightforward: halving charts work best on a logarithmic scale, each cycle has produced diminishing percentage gains, the fourth cycle is ongoing with new institutional dynamics at play, and no single chart or model should be treated as a guaranteed forecast.
Your next step is simple. Open a reputable halving chart on Glassnode or TradingView, switch to log scale, and study all four cycles yourself. Pair what you see with our Bitcoin fundamentals and crypto chart reading guides. Before making any financial decision, consult a licensed advisor who understands digital assets. Knowledge is your starting point, but personalized advice is what protects your money.